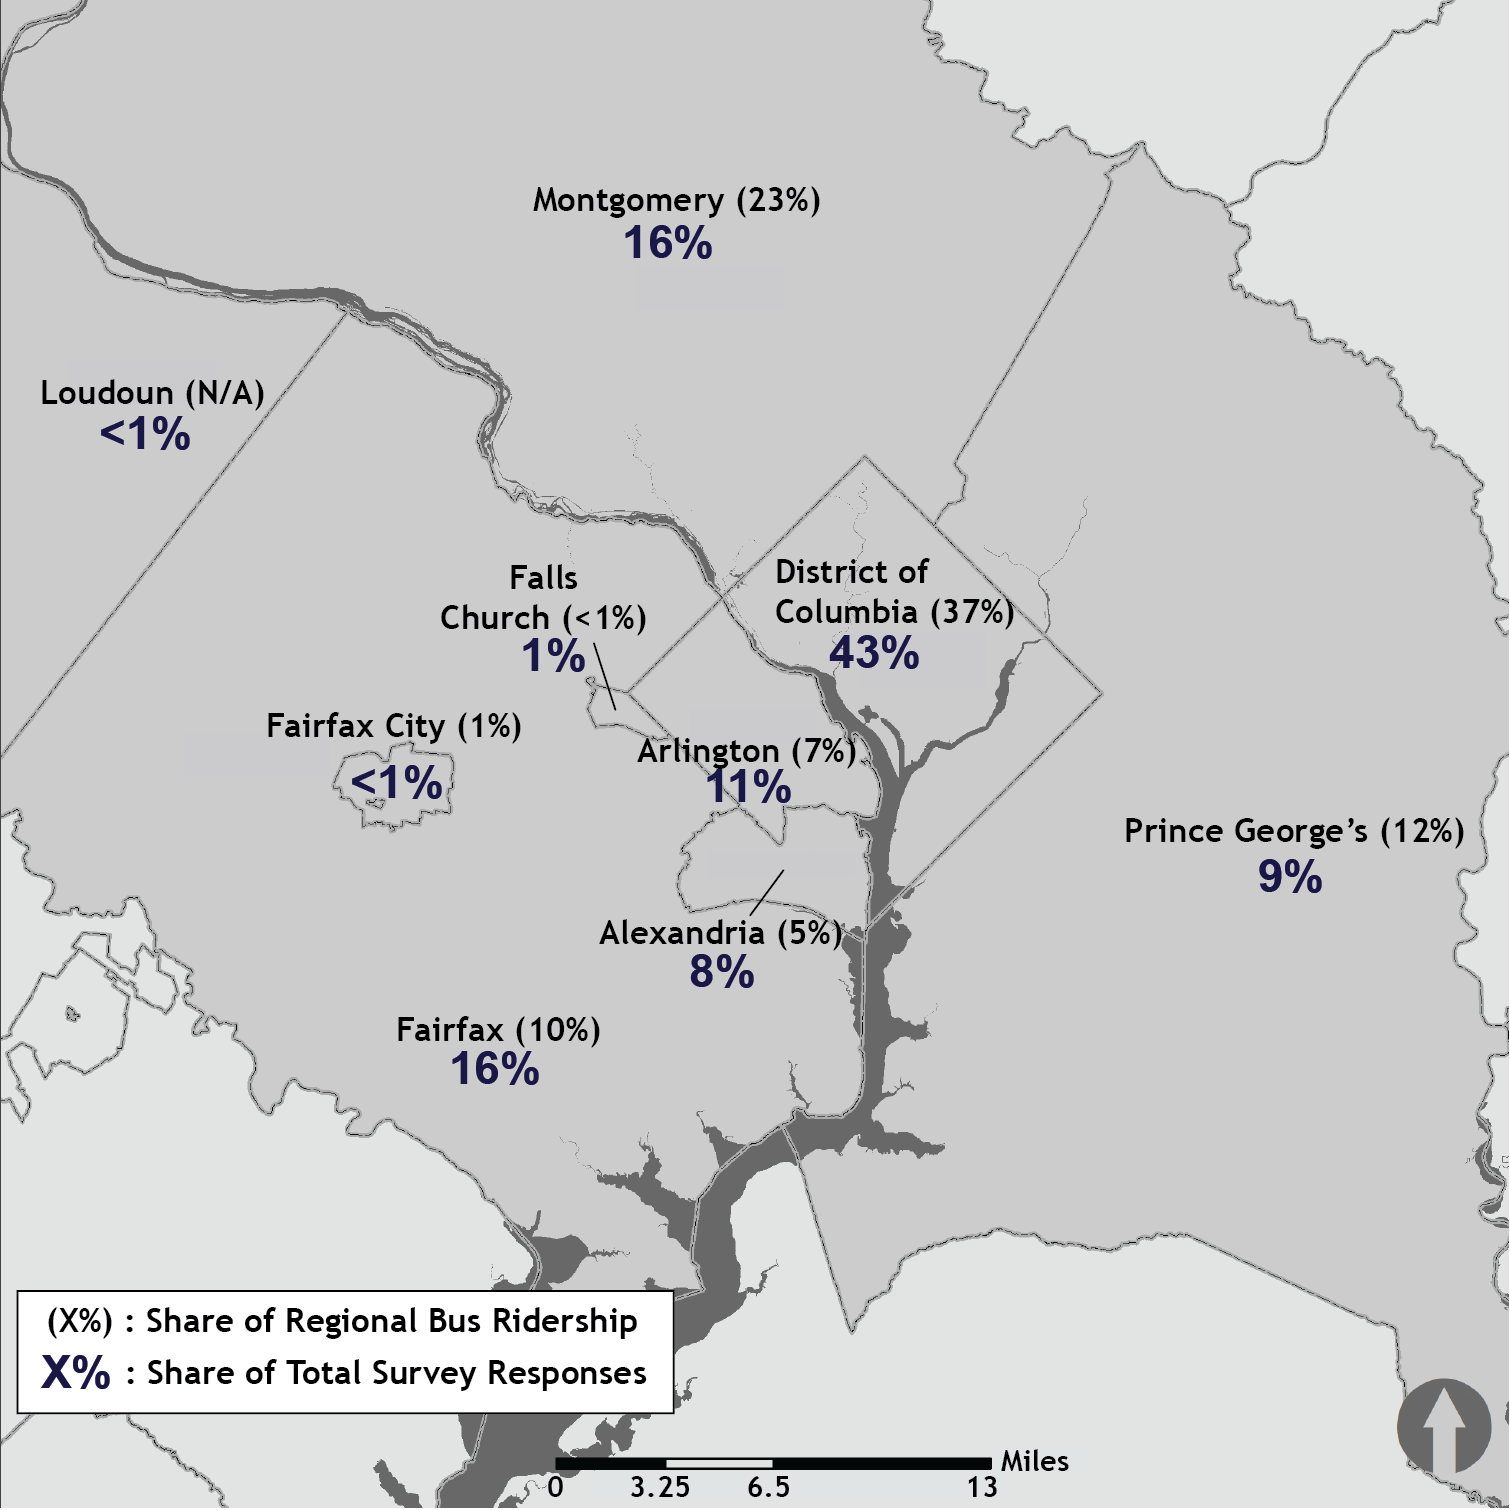
The Bus Transformation Project’s public mobility survey ran between September and November 2018 and received 5,679 responses through a combination of online engagement and 20 pop-up events throughout the region. A big thank you to all of you who participated!
Survey Results
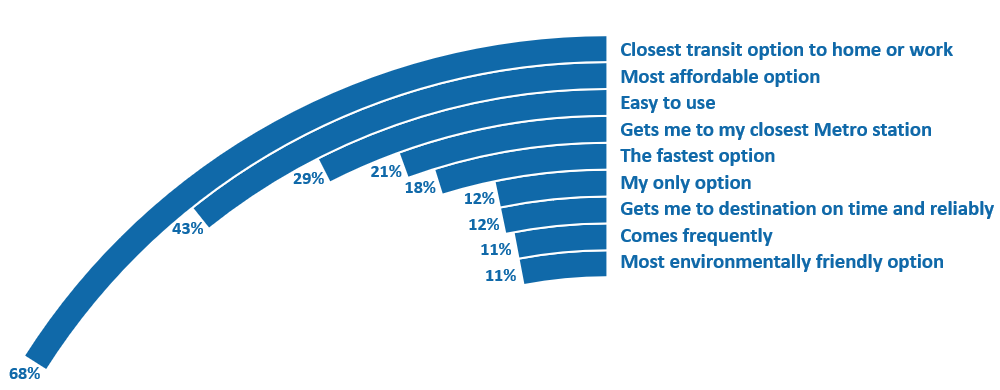
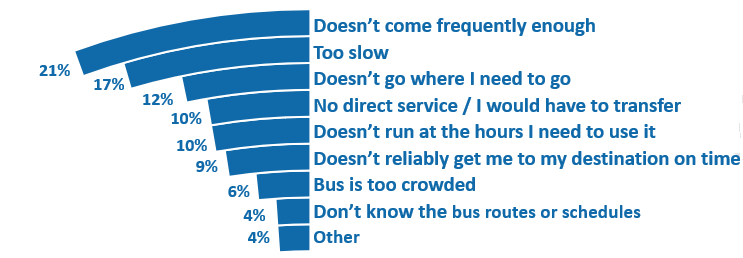
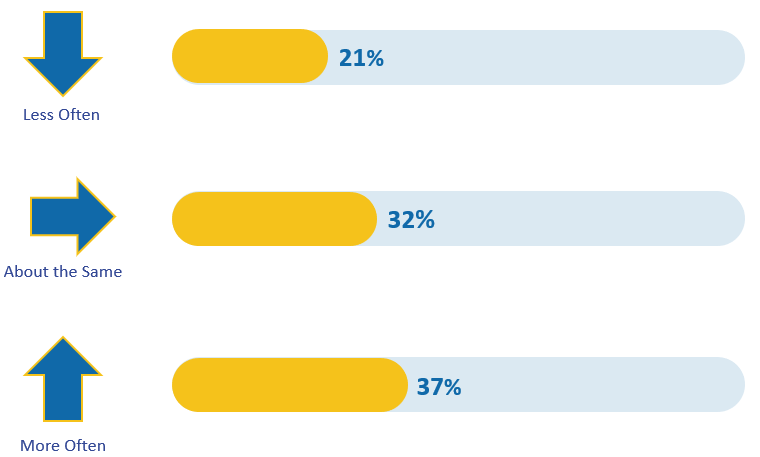
Below are some of the key findings we learned from the survey. The full report is available in the Project Documents section.
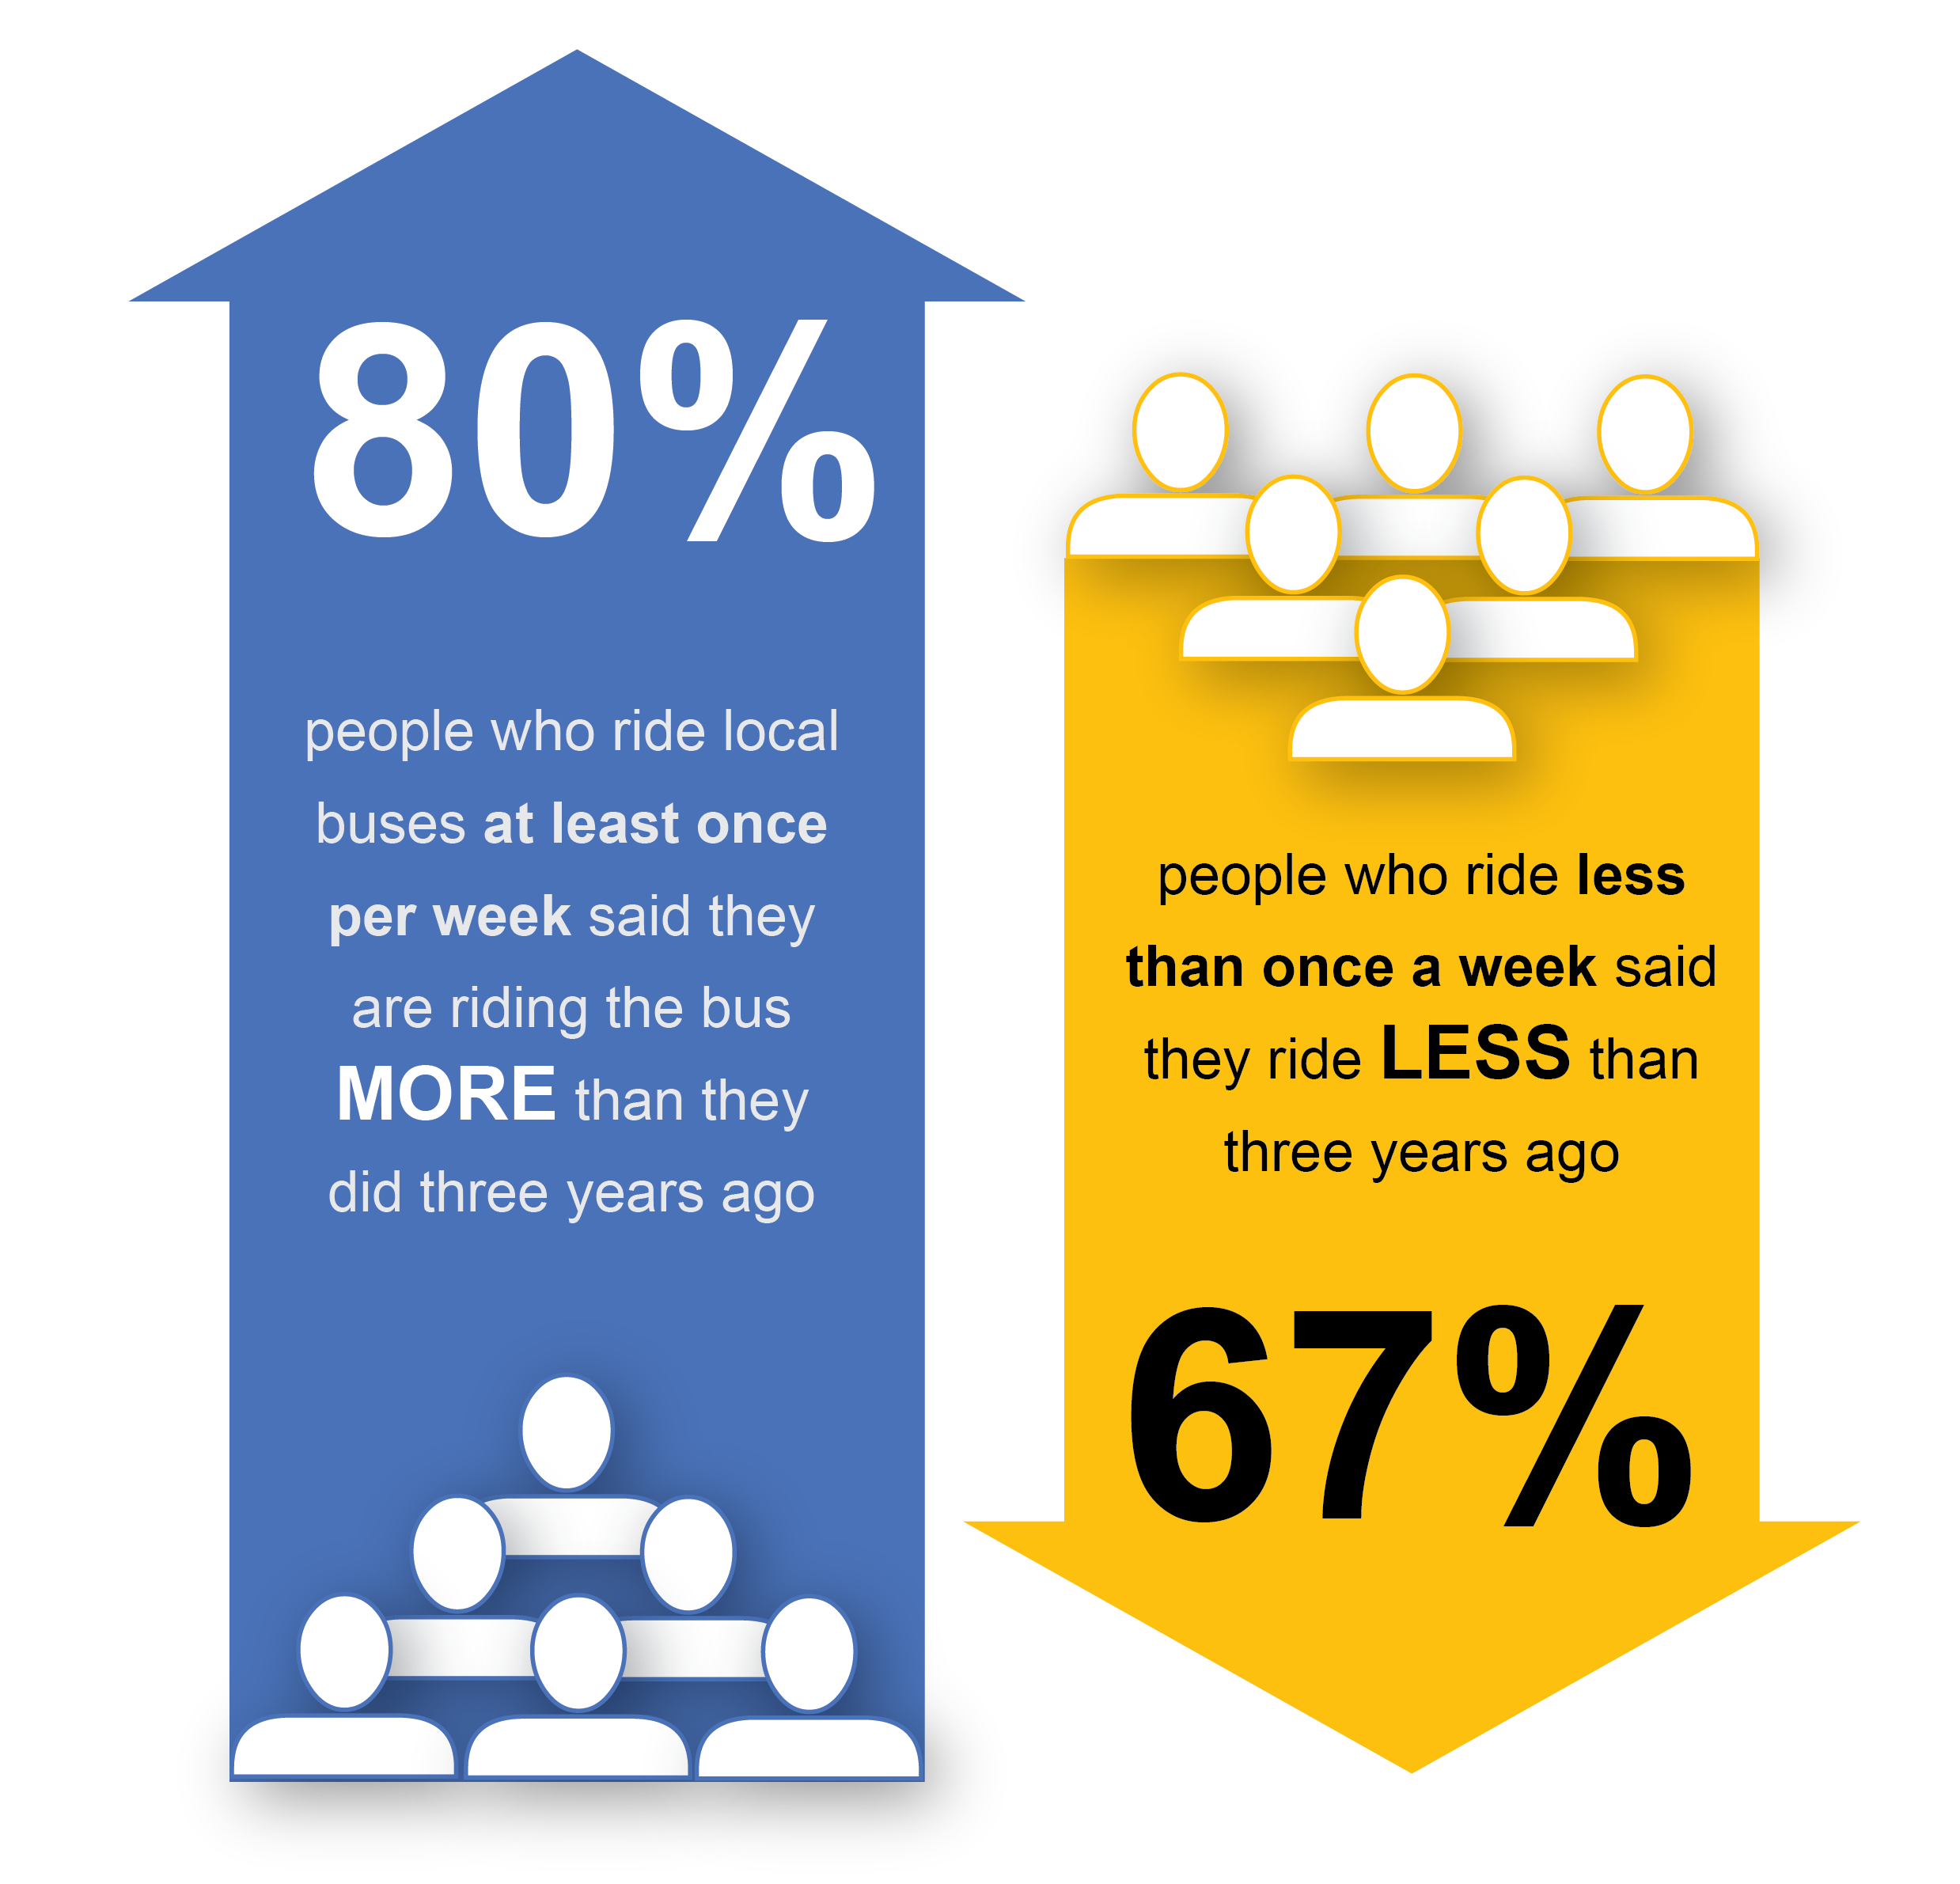
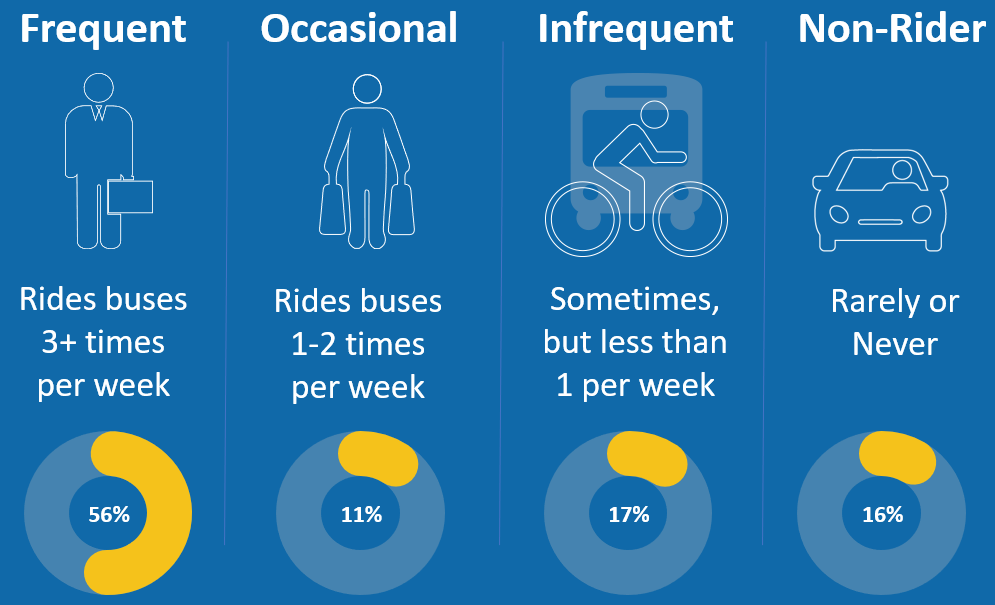
However, these results were not consistent among all groups of riders. Eighty (80) percent of people who ride local buses at least once per week said they are riding the bus MORE than they did three years ago, while 67 percent of those who ride less than once a week said they ride LESS than three years ago.
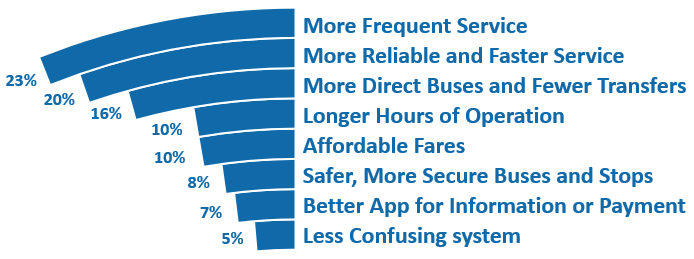
There was a strong consensus about the highest priorities for bus service! Respondents collectively assign about 60 percent of their preferred priority to more frequent service, more reliable and faster service, and more direct buses and fewer transfers. This was true for every demographic group and for both frequent riders and non-riders alike!

